Categories
Leisure Olympic Park

Inside the Olympic Park

A couple of weeks ago, I went on one of the daily tours of the Olympic Park in London, organised by the Olympic Delivery Authority. Anyone can now go on these tours, rather than just local residents, but you do need to book a couple of months in advance. This summer is probably the best time to take the tour, as the “big build” of all the main venues is in its busiest phase. In theory, everything should be built by next summer, with a clear year to then test the venues.

The day I chose ended up being a grey and cold Sunday – not great for taking photographs – but it was still very worthwhile touring the site. The tours are on a single-decker bus, with a Blue Badge guide giving an interesting narration. After being picked up from Stratford and given a fold-out map of the site, we were then driven right around the A12 to Hackney Wick and the northern plaza entrance, where the bus was subjected to an elaborate sniffer-dog search, presumably just for show as the bus had already done several other tours on the day – and because we had no such check on re-entering the site from the southern plaza. It was a good opportunity for a safety and security briefing, though. (The northern plaza is where building materials are generally delivered – workers arrive several miles away at the southern plaza, generally from a DLR station there.)

First up was the Velodrome, aka the Pringle because of the distinctive shape of its roof. It’s close to the northern edge of the site and is very visible from the A12. Beside it is a billboard with an illustration of how it will look when complete:

Velodrome - Soon and Now (7628)

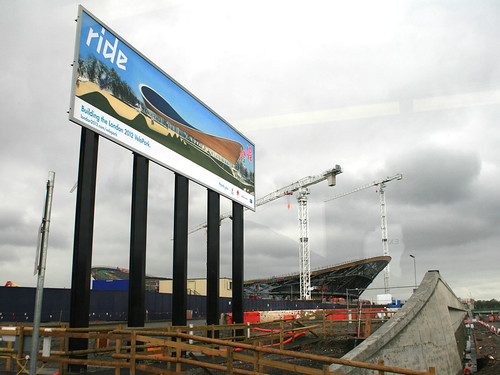
The Velodrome is one of the “Big 5” construction projects for the permanent buildings, along with the stadium, aquatic centre, athletes’ village and broadcast centre.

We then headed south, passing the basketball venue, a temporary building which has appeared from nowhere in just one month – already the “crazy paving” white plastic cladding is going on:

Basketball Arena (7650)

The Olympic Park isn’t the only building project going on in the area – along with Crossrail, the other big construction site is for the Stratford City Westfield development, which is more advanced and is due to open next year. A giant pedestrian bridge is being built between the two, and there is also a link road – the “Western Access”. The boundary between the two, with construction in all directions, is marked by a blue box:

Boundary between the Olympic Park and Stratford City (7654)

The stadium is visible from the northern section we were in, but the main construction road was blocked due to some temporary works on one of the many bridges bisecting the numerous rivers, canals and channels in the site:

The Way to the Stadium is Closed (7660)

So we headed back onto the A12, around to Stratford, and back into the site through the southern plaza, an electronic sign there showing an impressive safety record:

Safety Record (7671)

Firstly, we went up close to the stadium itself, the basic shape of which is complete. The black section is the “temporary” section, although it might be around for longer than planned after the Olympics depending on what the stadium gets used for:

Olympic Stadium (7689)

Olympic Road Sign! (7702)
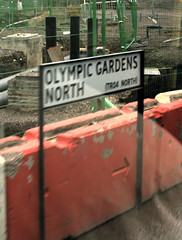
We then went round to the eastern part of the site, where the aquatic centre is. On the way I spotted many of the road signs which have appeared on the site – as well as Olympic Gardens North and South, and Stadium Crescent East and West, I had earlier spotted Handball Way, Handball Approach, Velo Drive, Stadium Aquatics Link, Plaza Approach, Soc Highway, Waterden Road Works South, Wetlands Avenue East, H08 Diversion and the intriguingly named Norman Corner.

All of these signs are mounted on “permanent” metal signposts and look like regular street-name signs. Rather than also showing the first part of the postcode, and is traditionally done for London street-name signs, these signs include reference numbers starting with “TR”. (Trunk road?) I’ve added all the names I spotted to OpenStreetMap.

The aquatic centre is being built by first placing the roof on its supports, and then filling in the space beneath it. The dramatic Zaha Hadid wave shape of the roof looks brilliant up close:

Aquatic Centre - Side View (7724)

From one angle, it appears to hang over one of the water channels:

Aquatic Centre beside the River Lea (7719)

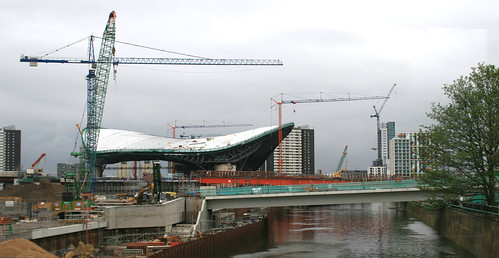
From another, it looks like a futuristic space ship:

Aquatic Centre - End-on View (7716)

I headed back home along the Greenway, a raised route through the site, open to the public and the best way to see the site if you aren’t on the bus tour. Along the way, I noticed the mysterious concrete posts, that appeared a few months ago, have finally revealed their purpose – they are rather fancy signposts:

Greenway Sign (7738)

You can see more pictures I took in my Flickr album.

Categories
OpenStreetMap

National Library of Scotland Historical Maps

The National Library of Scotland’s high-quality scans of historical Scottish mapping have been made available under an Attribution licence, which means they can now be used to trace features for OpenStreetMap in Scotland. While the maps themselves were already out of copyright, the high quality scanned imagery itself was still subject to copyright.

You might think that, with the recent releases of up-to-date(ish) Ordnance Survey mapping in various scales and formats for the whole of the UK, historical mapping is less useful for OpenStreetMap. After all, why use 60-year-old mapping, available in raster form and available at (relatively) low resolutions, when resolution-free vector data, and 1:10000 rasters of the same area are similarly available. But these beautiful old maps contain a lot of detail not on the newer ones, and for large parts of rural Scotland, where roads, rivers and mountain features very rarely change, they will still be enormously useful for completing the more remote parts of the country.

The historical maps can be viewed here. As you zoom in a few levels, the projection changes into the regular EPSG900913 (the tilted north lines are a tell-tale sign) that can be used directly in OpenStreetMap editors such as Potlatch.

Here’s Applecross, a place near Skye in North-West Scotland that I have long wanted to visit. In this particular area, historical imagery (OS 7th Edition) is already available on OpenStreetMap, allowing for tracing, but this is not the case for most of Scotland, as many of the sheets are still in copyright.

National Library of Scotland (Historical):

Ordnance Survey Street View:

Ordnance Survey 7th Edition (Historical):

The current OpenStreetMap Mapnik render:

Categories
Technical

Easy Webpage Scraping with Python

To produce the tube station usage mashup I obtained the data from the TfL website. Unfortunately the data is not in an immediately usable format – rather than there being a CSV file to download, or a large HTML table, the data is presented as a separate webpage for each station and each year.

Luckily, Python makes it easy to get the data as a CSV file – although you do need to know a little Regex too, to extract the data you want. To construct the regular expressions needed, I used an excellent online tool, RegExr.

Once you have your regular expressions ready, you just use Python’s Urllib, RE and CSV libraries, and some loops, to download the webpages, get the data, and write it into a CSV file.

Here’s the script I used – note I’m using the back-slash character at the end of some lines below to indicate line continuation:

import urllib2, re, csv

stationnums = {2003:4, 2004:4, 2005:4, 2006:4, 
2007:4, 2008:6}

addressPre = "http://www.tfl.gov.uk/tfl/corporate/
modesoftransport/tube/performance/entriesandexits.asp"

indRE = '.*?salign=right>([0-9]{1,9}?)</td>.*?'
totalRE = '.*?smillions)s=s([0-9.]{1,9}?)</strong>.*?'
nameRE = '.*?selected>(.*?)</option>'

resFile = open('results.csv', 'w')
resWriter = csv.writer(resFile, quoting=csv.QUOTE_MINIMAL)

for i in range(2003, 2009):
	for j in range(1, stationnums[i]+1):
		address = addressPre + "?id=" + str(j) 
		+ "&agekey=" + str(i)
		html = urllib2.urlopen(address).read()
		indRes = re.findall(indRE, html)
		totalRes = re.findall(totalRE, html)
		nameRes = re.findall(nameRE, html)
		if len(nameRes) > 0:
			resWriter.writerow([i, j, 
			nameRes[0], totalRes[0]] 
			+ [e for e in indRes])
resFile.close()

Change the stationnums values for each year to 304 (except 2008, to 306) to get all the data.

Categories
Data Graphics Mashups OpenLayers OpenStreetMap

Tube Stations in London – Visualisation

I was inspired by seeing this map and associated article on the New York Times website, linked from Going Underground, to create a similar mashup/visualisation of entry/exit volumes from the 300-odd tube stations in London. On their website, Transport for London provide the metrics for entries/exits from the stations, between 2003 and 2008, broken up into rush-hour, regular and weekend travel.

Each circle’s area is directly proportional to the flow numbers for that station (click on the circle to see the numbers.) The circles are rescaled between the first metric (total flows) and the rest, so direct comparison of metrics is possible except between the first and others, Blue circles represent an increase in flow and red a decrease.

If the mass of circles are obscuring each other, zoom in!

You can try it out here.

Some technical notes:

The background map is a custom render of OpenStreetMap data, with the tube lines highlighted in their traditional colour – it doesn’t always look quite “right” when you zoom in, due to the way the lines are tagged in my own copy of the OpenStreetMap database. The stations are even harder to disambiguate, so I’m using a free source from Wikimedia Commons, this means they don’t always line up.

Because your browser gets a copy of all the flow data when you load the page (yes I’ve heard of AJAX) it does run a little slowly in Internet Explorer, particularly the slider bars – these allow you to “drag” through the range of metrics or years.

Categories
Leisure Orienteering Orienteering Events Log

E9: Gridded

So, I ran in the Nike Grid ARG (alternative reality game) on Saturday, concentrating mainly on the E9 postcode in Hackney, but also going jogging around the City of London (EC1, EC2, EC3 postcodes) doing an informal City of London Race. The aim of the game was to log runs between four specially designated phoneboxes in each postcode, dialing in at the start and end of each leg. The more legs done, the more points you got – bonus points were available for running early/late, doing a fast run, completing every possible leg, and the most number of legs.

My strategy was hampered by having a severe hangover from the night before, so I didn’t make it out of the house until 3pm (the game ran from 8pm-8pm) and was pretty dehydrated. It was also a very warm day – and, to make things worse, the phoneboxes themselves acted as heat reservoirs. One City leg went via a supermarket and its chiller cabinet…

In my first session I essentially ran all of the six possible legs between the four phoneboxes, and several extra legs between the two closest ones. In the later session (after my jog around the City) I again aimed to run all six possible legs, getting the fastest split bonus for each, but realised near the end I wasn’t going to make it to/from the far one, so repeated some of the smaller legs. The many people enjoying a cool drink in the garden outside the Royal Inn on the Park, immediately opposite the most southerly phonebox, must have wondered what was going on.

The map below shows the routes I took between the four phoneboxes, marked with green rectangles:

In total I ran around 16.5km (10 miles) in the E9 postcode. The phonebox dialing process meant I essentially had a two minute rest after every leg – the longest of which I did in just under 10 minutes. My shortest leg was 1m 26 – I tried this one again and again but my times kept getting worse with each attempt!

I ran into the last box about 10 seconds before the game closed – I had to push it for this final leg and got bonus points for running this leg in the fastest time. (In fact I think I picked up all six of the fastest leg bonuses during the day.) The Nike team were filming this last phonebox and interviewed me afterwards.

I was extremely unlucky not to win – notice how close I finished to the eventual winner in the leaderboard below. However I did get 110 of my points in the dying seconds of the race. The guy who finished third appeared at the same phonebox a minute later (i.e. too late) and, had our arrivals been reversed, he would have finished in front of me.

Although I didn’t win, a friend won not once but twice in a different postcode, so I’ll at least get to see what prizes I missed out on!

There were some “bugs” in the game – certain phoneboxes in the City had quite unresponsive keypads which made it difficult to clock in at the end of the leg. Quite often, the automated service appeared overloaded and stopped talking half-way through, leaving you wondering whether the run had been correctly logged or not. The game leaderboard was updated in real time, which was impressive, but it was written in Flash so I was unable to see how I was doing on my iPhone. (A dedicated iPhone app would have been cool.) There luckily weren’t many players in my postcode, but many more would have clogged up the system – it took 1-2 minutes in the phonebox to stop and start each leg. Some clarity on how many points were on offer would have helped me refine the strategy, although I suppose part of the challenge is figuring it out for yourself. A couple of “test” 3am short legs I tried on my way back from the pub didn’t count for “early” bonus points, although game messages suggested they would at that time. Finally the maps weren’t too great – some phoneboxes were in the wrong place. I had however done a bit of online research first though and used a marked orienteering map instead, so this didn’t affect me. A friend of mine greatly benefited from one phonebox not being themed – he was the only person in that postcode who realised it was still a game phonebox and so completely destroyed the opposition.

It must have been a nightmare to organise, with nearly 150 postboxes scattered across many miles that needed theming, maps distributed to them, checking and fixing them – not to mention answering the many and varied questions and complaints on the Facebook event page, and writing the software to handle the automatic logging, updating and cheat detection.

Overall I really enjoyed the style of the event. There was definitely something of “The Matrix” about sprinting through the grimy streets to a phonebox (themed in green and black, too!) and breathlessly grabbing the receiver in front of surprised bystanders. All things considering, it was a nice “Real Life 2.0” take on the street orienteering theme. Not sure we’ll see this repeated – Nike generally organise a “concept” event in London yearly but each year’s idea changes dramatically to keep things fresh – however I would certainly love to try it again.

Categories
Mashups OpenLayers OpenStreetMap

Manchester Map Mashup

I’ve created a mashup of lots of maps of Manchester as a proof-of-concept of how easy it is to mashup using OpenLayers. It’s not particularly pretty but does involve lots of maps.

See it here.

The layers are:

  • OpenStreetMap
  • Ordnance Survey Street View
  • Ordnance Survey 1:25000 First Series (1959)
  • Ordnance Survey New Popular Edition (1948)
  • Marr Map of Housing Conditions (1904)
  • Swire Map of Manchester (1824)

The first four maps are all hosted on OpenStreetMap servers.
The Swire map also contains an inset, dated 1650!

Categories
OpenStreetMap

OpenStreetMap: 250,000 People

The OpenStreetMap project, as of today, has over 250,000 registered users. It is fair to say that most of these will never edit the map, or have just edited it to put their house in and then don’t return, but there are also a large number of active contributors to the project, such as the London community. Over 40,000 “ways” (generally, roads) are being added to the project every day. The project is continuing to grow, and the release of usable Ordnance Survey (OS) data covering the country, at the beginning of the month, looks like it will advance the project, rather than reduce its relevancy in the U.K. For the first time, a quick way to “complete” the roads is available, but there are many other features still to add which will keep contributors busy for years to come. For one thing, none of the OS data includes paths and tracks, and it’s not completely up to date, unlike OSM which sometimes gets roads added on the day they open – or before!

The London community at the moment is concentrating on filling in the building areas in central London, so the map here looks less like a “patchwork quilt” of filled and unfilled blocks, and more like the contiguous mass you see in other cities like Stockholm, Frankfurt or Milan. (Having said that, we are well ahead of Paris, Barcelona, and, suprisingly, Berlin.)

Our next pub/map meetup is in Holborn on Wednesday evening – come along!

Categories
Leisure OpenStreetMap

Nike Grid – Nice Idea, Shame about the Attribution

[Update – Nike Grid is back in late October! – and they sorted the map this time.]

Nike are running an event next Friday/Saturday in inner London called Nike Grid. It’s a great idea – basically players run between any two specially marked phoneboxes in a postcode area (e.g. E9). Typically there are 3 or 4 such phoneboxes in each area, each temporarily branded with the event logo. At the beginning and end of the leg, the player phones a special number from the phonebox, entering their player code. As the call comes from the phonebox, it’s proof that the player is there then. Players then earn badges by doing the most number of runs in a postcode, doing all the possible combinations, the fastest run, the hilliest run, etc.

Like I say, a great idea. It’s a technologically advanced version of street orienteering, similar to what my club has been running in similar locations in central London over the winter and it’s a shame that Nike doesn’t mention the “o” world anywhere in their publicity for the event – but maybe orienteering is a bit anoraky for their brand experts? (Nike don’t make orienteering shoes anyway, but their big rivals, Adidas, do – my current o-shoes are Swoop 2s.) It’s a missed opportunity to promote the (sub)-sport to a market that likes running, is happy to be holding a map as a different challenge, but has never heard of orienteering.

On the left is part of the map my club used for a street-o in Bow, below it is Nike’s version.

To pick your way between phoneboxes, you get a map – downloadable from the website, or collectable in paper form from the phoneboxes themselves or the Nike stores in London. There’s four maps, representing south, west, north and east London – the coverage generally extends out to the edge of zone 2. I visited a few of the phoneboxes this evening and picked up the north and the west maps (the south and east ones haven’t been put out yet, or have all been swiped already). On the maps, the phoneboxes are shown as green hexagons and the rest of the map is a rather pleasingly mimimalistic white-on-black design, rather like some of the other great cartography you can create out of the OpenStreetMap data for inner London that I and other project volunteers have collected.

In fact, wait a minute. Some of the detail on the maps around my home area looks rather familiar. Yes, they have actually used OpenStreetMap data for the map. I can see the characteristic kinks in the paths in my local park that I surveyed and that don’t appear on OS/Google/Teleatlas/Navteq et al map data. Nothing wrong with that – using OpenStreetMap data commercially such as promoting a brand of shoes is just fine. Except they haven’t attributed the project or stated the licence the maps fall under – both requirements of using OpenStreetMap data to create a derived work, especially in printed form. Oops.

Why am I bothered? Contributors of open data don’t do it for the money (mostly) but for the “kudos”. In the case of OSM, the project itself typically gets attributed rather than specific contributors, for practical and logistical reasons. The contributors are still acknowledged in the data itself. The project benefits from acknowledgement because publicity will help increase the number of contributors to the project and so increase the quality and completeness of the map data, making it in turn more viable for future uses. Everyone wins.

All they need to do is (a) add a line to attribute the project, such as “Map data (c) OpenStreetMap and contributors, CC-BY-SA”, to the maps concerned on their website and future printed copies, and (b) not be surprised if people make derivative works from the maps, which is allowed by the licence the data has been used under. I’m tempted to create an interactive map for the whole of London or indeed the world, in the same style – the cartography is very nice.

Incidentally the map is created using quite an old copy of the data, from before last September – some of the more recent roads I and others have added to the project don’t appear. The designers have also enhanced the widths of some of the major roads, and added in road names and numbers. Roundabouts have also been added in as proper circles. There are some mistakes in the process they’ve used – the main track (highway=bridleway if I recall correctly) around Victoria Park doesn’t appear, but the paths (highway=path) that lead to it do, resulting in a rather odd “gappy” looking bit of cartography around there, ironically a similar quirk of the Google maps of the same area.


Also, I’m not sure where the postcode boundary lines come from, but they mis-align somewhat with the OpenStreetMap data – in some places the lines wander near, but not exactly along, the centreline of a boundary road. You can see a particularly bad mismatch between the green line (postal boundary) and the white line (here a canal) on the left of the first map above. Just a cosmetic quirk.

It is a really great idea, and a really nice bit of marketing. I will, hopefully, have a go at getting a few of the badges during the 24 hours the game runs. Let’s hope they get the attribution sorted out.

(I notice it’s happening the same weekend as the London Marathon, who have Nike’s rivals Adidas as a key sponsor. The timing is not a coincidence, I’m sure!)

By the way, Nike have made it very hard to be contacted about this – there are no contact details on the game’s website and it is not possible to send private messages to the owner of the game’s page on Facebook, thanks to the way the social network sets up fan pages. Sigh. Of course, people in glass houses and all that, I should attribute the screenshots in this blog post – all the screenshots are of maps created using map data (c) OpenStreetMap and contributors, CC-BY-SA.

[Update – I have made minor edits to improve the clarity of the article and add the note about Google.]

Categories
Conferences OpenStreetMap

GISRUK Navigation Challenge

This is the map GISRUK 2010 attendees are using to get from UCL, where the conference is, to the River Thames, where the boat await for the evening cruise. On the way, some of them are doing the challenge, which is to take the optimum route to visit any 6 of the 12 control points – a blue plaque at each one to prove their visit. The map was made using the OpenOrienteeringMap map builder.

[Download PDF]

(Note: The start point was actually from just east of “B” rather than the triangle.)

I haven’t yet computed the best route, I think it’s probably BAJFED or maybe BMCKED. There is no “trick” best route, as the points were fairly fixed by the locations of the blue plaques. But the solution is apparently not immediately obvious to the human eye.

Categories
Conferences

Spatial Interaction Models for Higher Education

I gave a talk on spatial interaction models, geodemographics, and flows from schools to universities, at the CASA conference on Tuesday. This was on the work I did last year with Dr Alex Singleton.

My slides are here on Slideshare and below:

View more presentations from oliverobrien.