Categories
Orienteering

OpenOrienteeringMap and MapRunF

OpenOrienteeringMap, a website for creating a PDF street orienteering map of anywhere in the world based on OpenStreetMap data, has seen a massive upsurge of use since various countries starting locking down their populations during the Covid-19 crisis. Suddenly, many people have found their exercise limited to around their home area, and, if they aren’t lucky enough to live on a “proper” orienteering map, OOM is a great way of getting a simple map quickly – with blue plaques and (for the UK) postboxes pulled in with a single click as potential control sites.

At the same time, there have been a number of initiatives to combine the basic orienteering concept of navigating with a map between points, with the use of GPS receivers on the smartphones most of us carry, and their increasingly high-resolution screens, to virtually “punch” a control by being in the correct location, and carrying the map on the phone.

MapRunF is one such project – with an Android and iPhone app. Courses can be created on the phone itself using Google Maps aerial imagery, or .ocd format maps and courses loaded in from OCAD or Mapper. But if you want the authentic orienteering experience without needing to do “proper” mapping, OpenOrienteeringMap now offers two buttons to easy the import into MapRunF.

Once you’ve saved your map and course, you can click on the KMZ and KML buttons to download a map and courses file respectably. You can then upload these to Check Sites, note down the ID number, and load it into your phone running MapRun F. Straight away, you have your orienteering map and courses, ready to run!

The KMZ map file does not include the courses or start/finish marker, as these are contained within the KML course file. However, it does contain any crossing point “bridge” symbols or do-not-cross “X” markers that you added.

The KMZ and KML files also work in Google Earth:

Try OpenOrienteeringMap – the UK and Ireland editions update daily from OpenStreetMap, while the Global edition updates once or twice a year – but you can create a map at any time! Look out also for a daily updating Australia version soon.

Categories
OpenStreetMap Orienteering

The COMO Project and Seek ‘n Spell

Michael (of the Okansas blog) has recently mentioned two quite interesting orienteering-related ideas:

1. The COMO project, which is looking to use OpenStreetMap data to create orienteering maps. This is very similar to (although more advanced than) my own work – I looked at creating Street-O orienteering maps from OpenStreetMap data for my dissertation for my MSc in GIS last summer, and additionally built an Osmarender-generated/OpenLayers-based based map for viewing and printing such maps easily – although I never got around to releasing it publically. I’ve subsequently thought of extending the process for “proper” orienteering maps, while keeping the data in the OSM database. The COMO project is looking at creating “proper” orienteering maps, converting OCAD data into a form which can be read into a special database separate from the main OSM one.

As an aside, it would probably be easier not using the OSM flow or API, but rather a PostGIS database to store the data, with GIS applications such as Quantum GIS to do the editing. Mapnik as the rendering engine is considerably easier to set up, configure and use than Osmarender, too.

2. Seek ‘n Spell, which is an iPhone game, uses the internal GPS, the ability to broadcast your location to a central server, and aerial photographs, to create multi-player games where you can run around, collecting letters to spell words. See Michael’s post and also the video – the action looks uncannily like a combination between SLOW’s Mobile-O and a “normal” mass-start score orienteering event. The game-view reminds me of watching an animation of a race in Routegadget. The concept and the finish quality of the app looks great but the name is a dreadful pun – hopefully they’ll rename it something a bit snappier.

Categories
Mashups OpenStreetMap

Map of UK Scenicness… and Pubs

picture-5

Here’s a little something [no longer online] I knocked up, based on the MySociety scenic score data release last week, as well as OpenStreetMap’s data for the UK – including particularly its pubs.

Basically, the vote point data was converted to a surface, using an IDW (Inverse-Distance Weighted) function. The cell size was pretty small (1km), so there isn’t much smoothing across many vote locations going on – a single vote may cause quite a steep gradient. Instead, the surface effectively extrapolates the values into all areas. Some jiggery-pokery was required to first project the votes onto the British National Grid (so that x/y distances become equivalent) and then the resulting surface was fully rasterised and reprojected to Spherical Mercator so that it could be tiled under the existing OpenStreetMap network overlay. This was surprisingly painful to do.

Note that the photographs that were voted on generally weren’t of the pubs shown on the map, so the pub might well be extremely photogenic – but in an area where the nearest Geograph photos used in the dataset for the voting were not rated highly.

It’s good to see that the Scottish Highlands come out so green (i.e. scenic.) Urban areas generally don’t do too well, although the voting was generally quite critical, so a yellowish hue is still a sign of a very scenic part of a city.

Data came from MySociety (using photographs from Geograph) and OpenStreetMap. The pub icon came from Wikimedia. The map tiles were produced using Mapnik for the OSM network overlay and MapTiler for the scenic map. The increasingly excellent OpenLayers is used to display the tiles, and a point vector layer showing the pubs.

There’s many areas with apparently no pubs at all. This is simply because the data wasn’t in OpenStreetMap when I pulled it in on Friday. However OpenStreetMap’s data is rapidly becoming more complete throughout the UK at the moment, so a future pull of the data should reveal many more pubs.

Some very remote areas don’t have any vote data either, but the production of the surface uses and extrapolates the values from nearby votes instead.

scotland
Categories
Conferences OpenStreetMap

Open Source GIS is from Mars, OpenStreetMap is from Venus?

I’m going to a couple of conferences in the next few weeks – the 1st Open Source GIS UK (OSGIS UK) conference at Nottingham University, and State of the Map 2009, the 3rd OpenStreetMap conference in Amsterdam.

On the face of it, one might expect an overlap between the two conferences. In both cases, it is about a community geared towards developing and using open source (“free”) geo-applications to further understanding of spatial issues or “do cool things”.

But OpenStreetMap (OSM) is not in the title of any of the talks on the OSGIS agenda.”GIS” appears just once in the SOTM agenda titles – “Bridging the GAp: Using OSM Data with GIS Tools” by Jochen Topf should be an interesting talk.

I suppose the two communities are really separate, coming from two different sources, operating on two levels and with two aims.

  • The open source GIS community comes from academia, particularly Geography, and is interested in having the power to develop applications to advance research, without facing the user interface and functionality challenges of the big proprietary GISes, not to mention the expensive licensing costs. They already have the data – they’ve collected it, or negotiated academic rates for access to the national mapping agencies.
  • The OSM community comes from IT and just wants to do cool things with the data – but doesn’t have the willingness to pay commercial rates for the data – so they are more focused with getting the data in the first place. Once they have it, they are not willing to learn (or aware of ) GISes, which are complicated bits of software, at best, instead generally scripts for specific bits of functionality.

Two worlds, it seems, with “open” goals but seemingly little overlap.

Categories
OpenStreetMap

Milton Keynes Mapping Party

[Updated] I organised a major mapping party in Milton Keynes, a couple of weeks ago. Mapping parties are where a group of like-minded OpenStreetMap mappers get together to tackle a defined area, in the course of a weekend (or weekday evening.) These days in the UK, many of the mapping parties are “second pass” (adding names to roads and features traced from aerial photography) or even “third pass” (adding in points of interest and missing detail, or even building outlines and house-numbers). However, Milton Keynes is unusual in that it was almost entirely unmapped on OpenStreetMap – a “blank canvas”, despite being relatively close to London, the origin of the project. The mapping party was an opportunity to get the active London-based mapping community (currently doing the London Mapping Marathon) together, along with local mappers from Milton Keynes, including those at the Open University campus, and other interested people from further afield. Milton Keynes is a large town, with a low-density structure – its 180,000 residents are spread over an area of nearly 100 square kilometres. As such, a large turnout was going to be key to get the place completed in a single weekend.

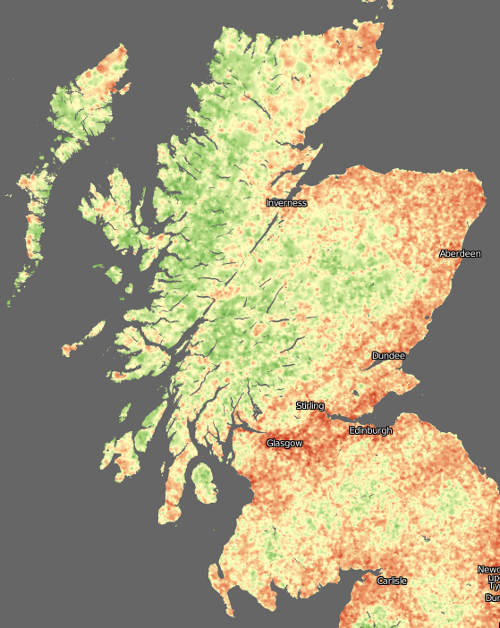
[osm_map lat=”52.034″ long=”-0.746″ zoom=”12″ width=”500″ height=”450″ marker=”52.051,-0.795″ marker_name=”wpttemp-red.png”]

The town is rather unusual in its design – a new town, split into numerous self-contained communities connected by a grid-pattern of major roads and roundabouts. This meant the “area cake” – splitting up the target area into segments for people to do individually – was easy to make, although many “slices” of the cake contained a large number of roads.

We did have a great turnout, with over 25 people over the course of the weekend, despite the brooding clouds on Saturday and intermittent rain on the Sunday. Both new and experienced mappers turned up, and we even had a family along, who mapped the central park. Those who hadn’t been before were generally impressed by the dramatic infrastructure of the town, with large, straight and almost empty roads. Milton Keynes is expanding rapidly – it’s set to double in size in the next 20 years – and it certainly has the infrastructure to do so, unlike almost every other town in the UK. This means many of the mapping providers (Google, the Ordnance Survey and Collins) have some of the newest areas completely missing from their maps. In theory, OpenStreetMap would have the most complete map of the town therefore, after we had visited all the areas. However, I underestimated just how far the town is expanding, and, having despatched myself to map one of the newest areas (Oxley Park and Westcroft in the far west of the town) I noticed several brand new suburbs which were not on any map. Unfortunately I ran out of time to completely map them all, having only given myself the Sunday afternoon to map, with Saturday spent organising things at the HQ. Having a dedicated meeting room in a hotel was a definite bonus (thanks to Twain for organising) but it was still a busy day with so many people converging at once.

The other aspect of the town that many found equally impressive and difficult to map, are that the town has three separate networks – the roads network, consisting of the grid roads and very wiggly interior roads, a comprehensive path network joining many of the cul-de-sacs together, and a large and complete cycle network – the “Redway” network, which is designed as an “alternative” set of highways for bikes. Unfortunately cycling in Milton Keynes has never really caught on – the distances are just too far – so this huge, dedicated network is almost completely unused. However the mappers on bikes found it a good, fast way to get to their allocated slice, and we tried to map as much of all three of the networks as we good.

In the end we just about finished the whole town – a few slices were left for local mappers to complete, and one of the London mappers even went back the following weekend to “third pass” the central business district, adding in the hotels and bars. I’m also back in the town in two weeks, I’m not planning on doing any active mapping but will check out our efforts on the newly rendered map.

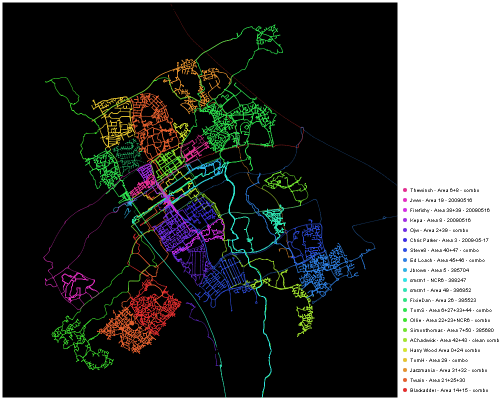
Being a GIS enthusiast, the best bit of the weekend was getting together all the GPX traces and creating the party render. You can see the animated version here.
mkpartyrender

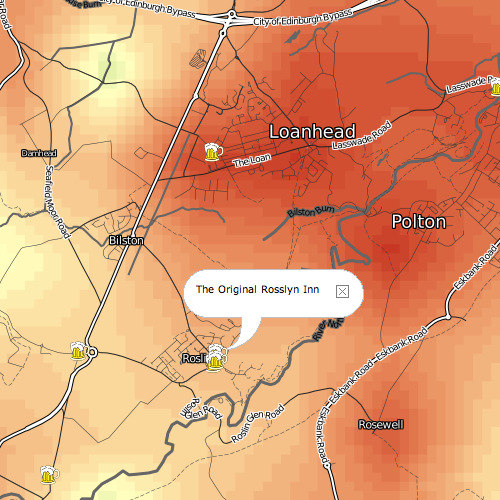
The second best bit of the weekend was making a special trip to visit the famous Concrete Cows:
Why Are You Taking a Photo of Me?
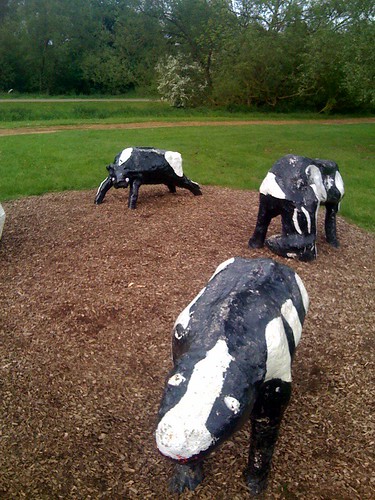
They are marked with the pin on the map above.

[Update – animation link fixed.]

Categories
OpenStreetMap

Testing the OpenStreetMap WordPress Plugin

[osm_map lat=”51.525″ long=”-0.134″ zoom=”17″ type=”Mapnik” width=”500″ height=”300″ marker=”51.525,-0.134″]The Pearson Building, UCL Geography.

Very nice. Hopefully there will soon be an easy way to put a pin on the map using this plugin. [Update: It’s been added – thanks!]

Categories
Conferences

MSc Dissertation

Last year (2007-8) I studied for an MSc in Geographic Information Systems, at City University London. The course was taught by an excellent team of academics and I can thoroughly recommend it as a good, technology-focused introduction to GIS. The highlight was the field-trip, a week away in the Lake District, carrying out three two-day projects, each involving planning, data gathering, preparing and presenting the findings.

The summer last year was spent researching and writing the dissertation. It is entitled “Use of a GIS for Production and Maintenance of Street Orienteering Maps: Can a GIS and Spatially Aware Data add Value to Orienteering?” and can be downloaded from here (24MB, 102 pages).

You almost certainly don’t want to read 102 pages, so there is an extended abstract here (1MB, 5 pages), entitled “Creating and Maintaining Street Orienteering Maps using OpenStreetMap”, which appears in the “Proceedings of the GIS Research UK 17th Annual Conference”, aka GISRUK 2009. I presented a poster summarising the work at the conference, which is reproduced below – linked to a larger version.

Poster for GISRUK 2009