The relaunch of Exeter’s Co-Bikes electric dock-based system has taken place today, following some previous operations the last few weeks. You can see the system live on Bike Share Map.
The new fee is:
Casual
Membership Fee
£0
Start Fee
£0
Usage Fee
£1/20 minutes
Usage Credit
N/A
Out-of-Hub End Fee
£24+
Out-of-Hub Start Credit
N/A
Journeys from 8-24 hours are capped at £24. Maximum hire is 24 hours – bikes hired for longer are assumed lost and the user is charged a hefty penalty.
Edinburgh Just Eat Cycles journeys in August 2019.
Edinburgh‘s Just Eat Cycles has reported a record month in August, the month during which the Edinburgh Fringe and Edinburgh International Festival takes place and the capital’s population significantly increases. The system launched in September last year, just too late for the previous Fringe/Festival month. This month, the system managed 17,529 rides, with around 400 bikes available through the month across 70 docking stations. This represents around 1.5 trips per bike per day (t/b/d). The system including the above graphic showing routes taken. Just Eat Cycles has since added some additional bikes in, in early September, and now has around 500 available.
Just Eat Cycles publishes its trip and availability data as open data. The Trip data is published within a day of the trips happening, an impressively quick turnaround. They also publish regular maps showing routes taken. The above map, for August, includes at least one trip to Edinburgh Airport and another trip to Cramond Island (accessible by a causeway only at low tide). The former doesn’t have a docking station so journeys incur an out-of-station fee, but the journey may still have been cheaper than tram/parking surcharges. The latter does at least have a docking station nearby, back on the mainland.
Monthly journeys, bikes and average trips/bike/day for Edinburgh, so far:
Month
Trips*
AvgBikes
Trips/Bike/Day
September 2018**
2277
140
1.1
October 2018
3799
186
0.7
November 2018
4047
302
0.5
December 2018
3662
360
0.3
January 2019
4750
233
0.7
February 2019
4222
108
1.4
March 2019
6549
341
0.6
April 2019
8176
441
0.6
May 2019
14160
258
1.8
June 2019
10214
243
1.5
July 2019
12290
309
1.3
August 2019
17529
386
1.5
* Journeys on the last day of the month are normally missing from the trips data. ** Launched mid-month.
Hopefully Edinburgh will get to 2 t/b/d soon – a figure which is, very roughly, is a good benchmark for a well used, long-term-viable system. Edinburgh’s design means it can very easily move docking stations around, to adjust to corridors of good use (and low vandalism), although this has to be balanced against the frustration of loyal users finding their docking station has gone.
Last week I was at FOSS4G (Free and Open Source Software for Geo) 2019 conference, in Bucharest, Romania. It was the second time I had attended the global conference, the first being back in 2013 in Nottingham. There are also country and region “mini” versions of the conference, including FOSS4G UK which I have also been to a few times. Relatively cheap airfares and hotel costs in Bucharest, along with the conference fee itself being low for early birds, along with the theme focusing on open source geo software that I use heavily (e.g. QGIS and OpenLayers) meant this was an obvious summer conference to go to. As it is the “canonical” conference for the industry, it means that many of the key technologies have core developers attending – and speaking. Hearing insight from the creators – rather than just vendors – is invaluable.
I attended the main conference days on Wednesday, Thursday and Friday. It was a packed event, with 11 simultaneous streams of talks, starting each day at 9am, and with social events in the evenings too. Two smartphone apps for the conference were a must – Attendify was a good interface work out which sessions to go to when. The app is full of annoying quirks, and ironically lacking on the map front, but does have a bookmarking system which was invaluable. Telegram was the other app, as there was a FOSS4G event group chat which was lively and frequently updated. Around a third of the 1000 attendees were on the group chat. Unfortunately I had to find out about both Attendify and Telegram from other attendees – registration didn’t tell me about these. You would have had much less of a conference experience without these apps.
Openlayers 6.
Day 1 – Wednesday – was the best day for me, as it included core developer talks on GDAL, OpenLayers 6 and QGIS.
The GDAL talk included mentions of ndjson (and so ndgeojson), whichI hadn’t heard of before but is being supported in GDAL 3. It also touched on PROJ 6 and TileDB.
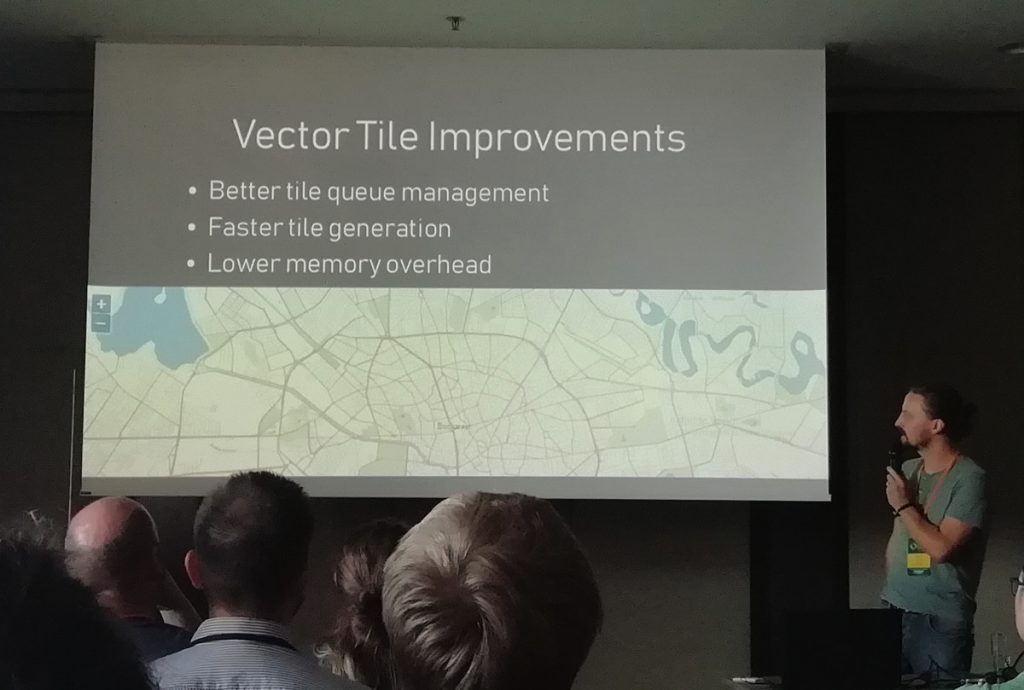
The OpenLayers 6 preview gave a good insight into the main optimisations and improvements being made – faster Vector Tiles, high-volume point-based vector rendering and arbitrary HTML elements as part of the map, to name but three. At the 2013 conference, OpenLayers 3 Beta was released – we’ve come a long way.
The QGIS talk previewed some of the work in progress in 3.10 and the next LTS release. QGIS 2 was launched at the 2013 conference – again, we’ve come a long way.
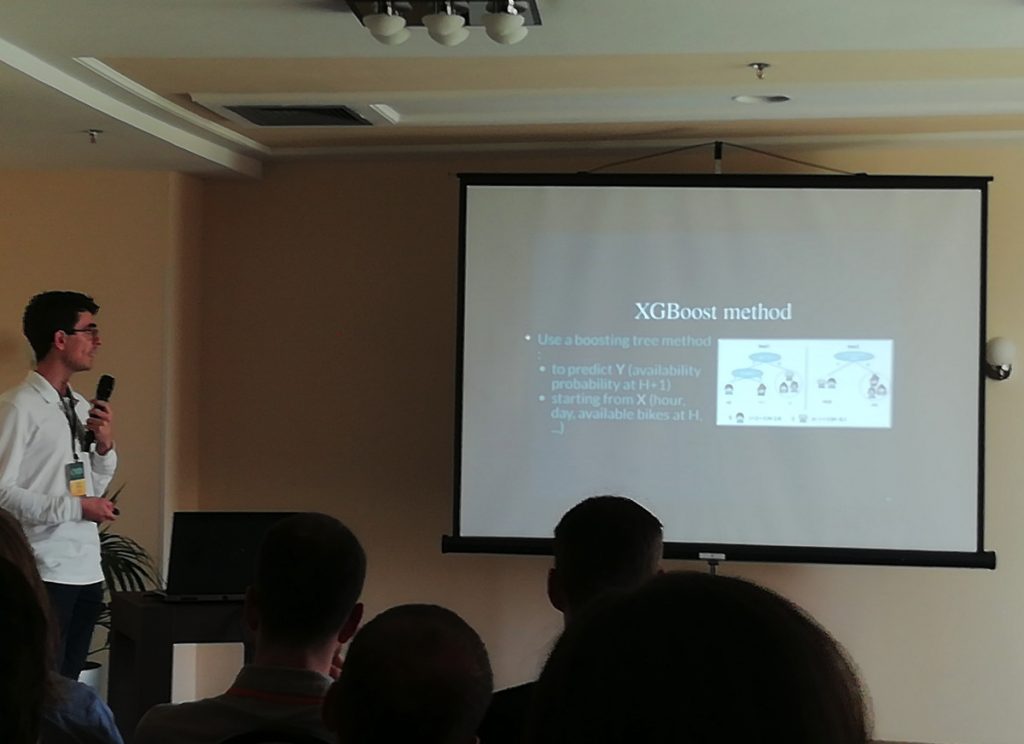
But the biggest surprise for me was one of the first talks – on bikeshare data visualisation, by Oslandia, detailing their python-based web application showing flows. My own Bike Share Map won Best Web Map back at FOSS4G 2013, and since then the industry has evolved a lot, and my map with it. I wasn’t expecting to see much in the way of bikeshare at FOSS4G, it being very much a technology rather than transport conference, so it was a nice surprise.
Bikeshare data clustering using open software.
Day 2 – Thursday – was not quite so unmissable for me, although this may perhaps have been due to the icebreaker event at Bragadiru Palace, following by a long walk back through central Bucharest in the evening heat – stopping off at Caru’ cu Bere, an intricate neo-gothic pub/restaurant that reminded me of the Cittie of Yorke in London.
Anyway I enjoyed the talk on PGRouting although I would have loved to have learnt about the differences between the main routing algos that have recently been added to it.
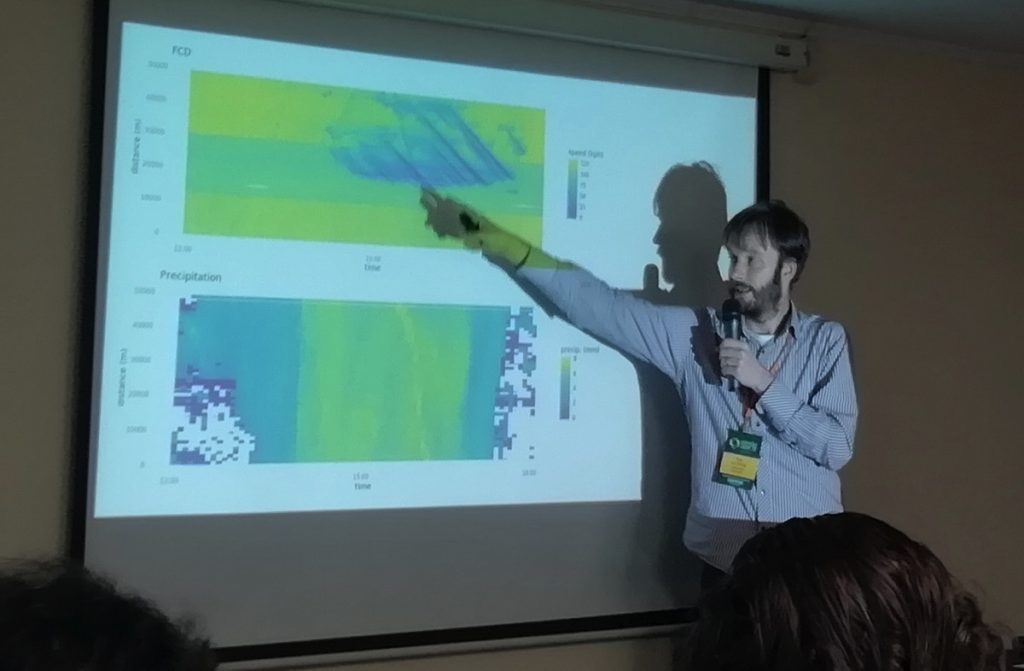
The best talk (for me) of the whole conference was on this day and was one that I hadn’t even been planning on attending. It was “Analyzing floating car data with clickhouse db, postgres and R”. It only had a teeny bit of R in it (I’m a python person) and was a great example of crunching a big dataset (all major road vehicle speeds and weather conditions grid data) using a specialised database, and visualising effectively.
Car speeds in the Netherlands and the effects of weather.
Day 3 – Friday – kicked off with “What’s new in PostGIS” was another unmissable talk – PostGIS’s importance in the FOSS4G community being acknowledged by it being a plenary rather than parallel-session talk, and so hosted in the 1000-seat National Theatre auditorium. Unfortunately this meant it was on at 9am, and so I opted to watch this one on the excellent, high-quality live stream being broadcast by CCC, from my hotel room, before checking out and going to the remainder of the conference. CCC’s production quality and coverage is perhaps one of the best things of the entire conference.
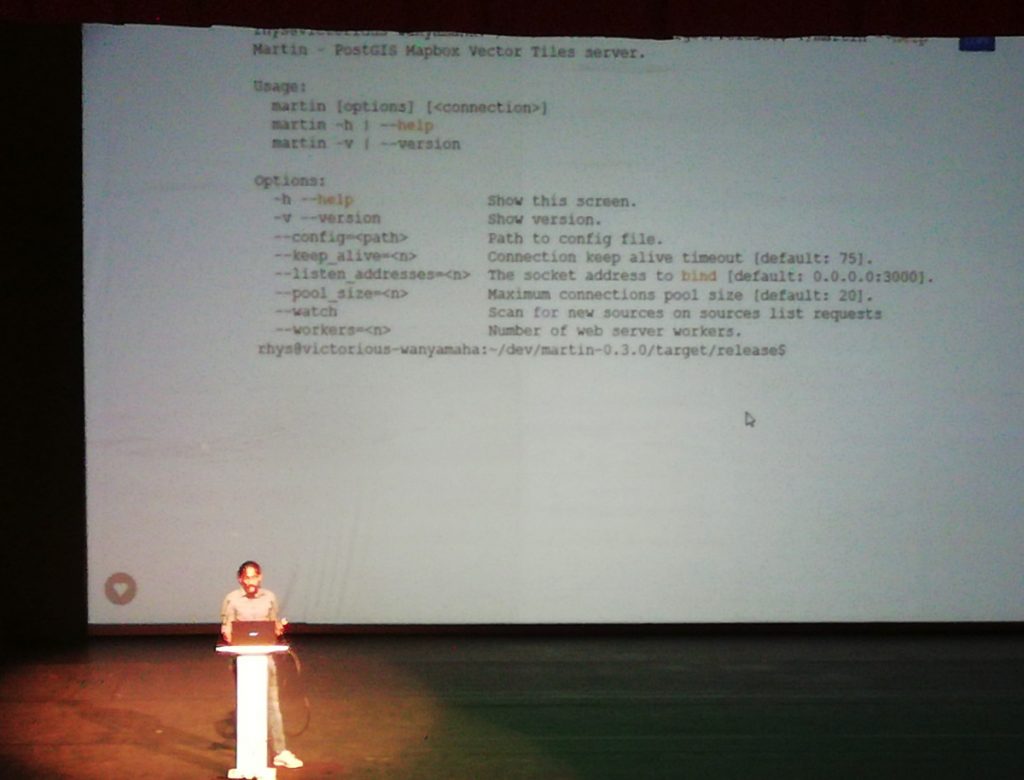
Other good talks on the final day included an integration of OpenLayers with the decidedly non-open-source Power BI platform, and a demonstration of Martin (a PostGIS-based vector tile server written in Rust).
QGIS on the Road sounded promising, but was a little too contrived (using QGIS to plan a bee-keeping hobby) and also too long – it was a triple-length session unexpectedly without breaks and was more of a tutorial. I was hoping there would be a demonstration of QGIS on mobile devices.
Finally a talk on GNOSIS style sheets – I certainly think any consideration of good cartography is a good thing, but feel there are already excellent ways (e.g. SLD, or Mapnik/CartoCSS) of standardising cartographic style sheets on the web.
Martin, a vector tiles server.
As previously, there were some themes that I would have liked to see more of such as on advanced Mapnik usage. There was also little on Leaflet, which was a surprise. Heavy users of the open source geo-toolstack didn’t have a huge presence – e.g. Mapbox. Indeed, Google and ESRI, two non-open vendors, were more visible. Like back in 2003, there is little if anything on D3. I was also surprised to see little mention of MapShaper or Shapely.
The other thing was that the OSGeo AGM sessions, representatives of the many incubator and other supported projects had around 30 seconds each to introduce their work and progress in the last year. I hadn’t heard of many of these, and ideally, every OSGeo incubator and supported project would have a least one 20 minute talk during the main conference itself, as an audience education. Perhaps something for the future conferences.
Opening Plenary session in the impressive National Theatre.
So overall another excellent, well organised conference with many good talks and also excellent community networking opportunities. The facilities were good (even if the hotel changed the names of some of the rooms after the programme went to press!) and there was something for everyone in the community. I don’t know if I’ll make it to FOSS4G Calgary in 2020 – I probably should start writing some open geo software first – but hopefully I will make it to another FOSS4G before too long.
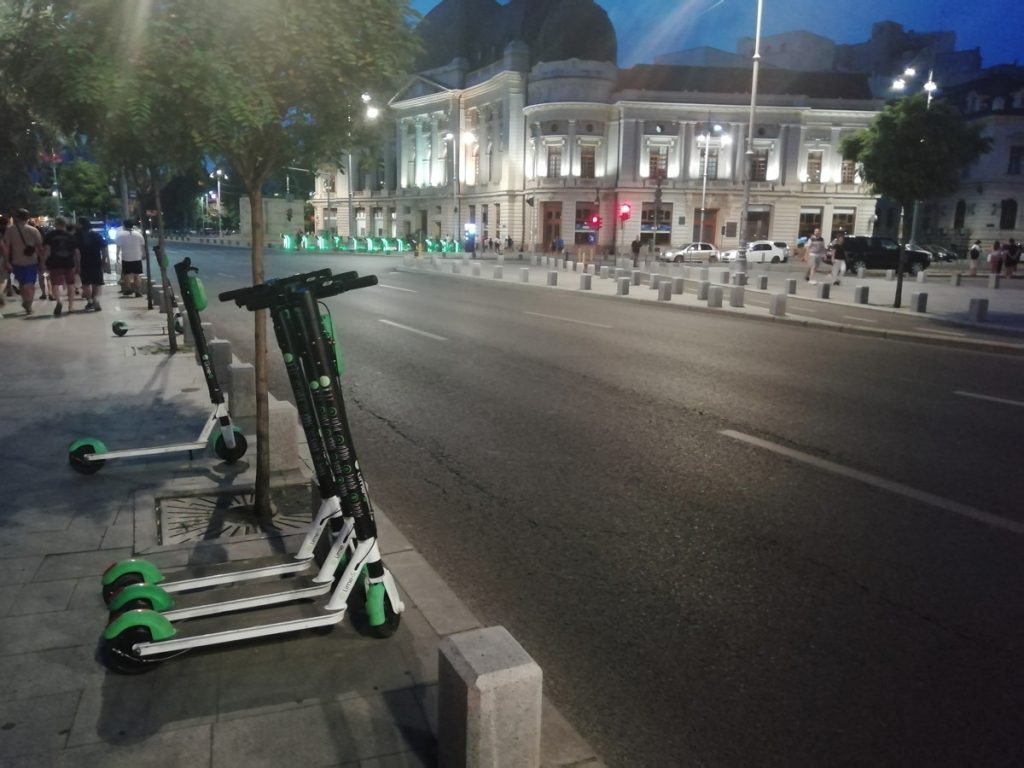
Lime eScooters-for-hire in Bucharest, with the older bikesharing system behind.
Micro-MaaS in Bucharest
A note on Bucharest’s micro-MaaS options – it currently has a third-gen non-electric bikeshare, L’Velo Urban although it covers very little of the city, and requires potential users to go one of two manned booths during working hours to get a pass to operate it. So hardly user-friendly. I saw a grand total of one person using the system during my entire 3 day stay.
The other option is eScooters – Lime and Wolf-E are both present. Lime is surprisingly expensive – the equivalent of 60p to start a journey and then 12p/minute. Nearly as expensive as London, in a city where food, drink, the metro and taxis are far cheaper. Indeed, it’s probably about double the rate of getting an Uber. Despite that, there were loads of people using Lime – I didn’t see anyone using Wolf-E. So, Lime may be on to something – there are plenty of people who are brave enough to scoot on the roads (which are dominated by traffic bombing along a way that London traffic doesn’t) and happy enough to pay for what seems like an expensive option – perhaps because it is the only fast option that doesn’t get held up in the pretty bad traffic the city has (there are not many bus lanes either).
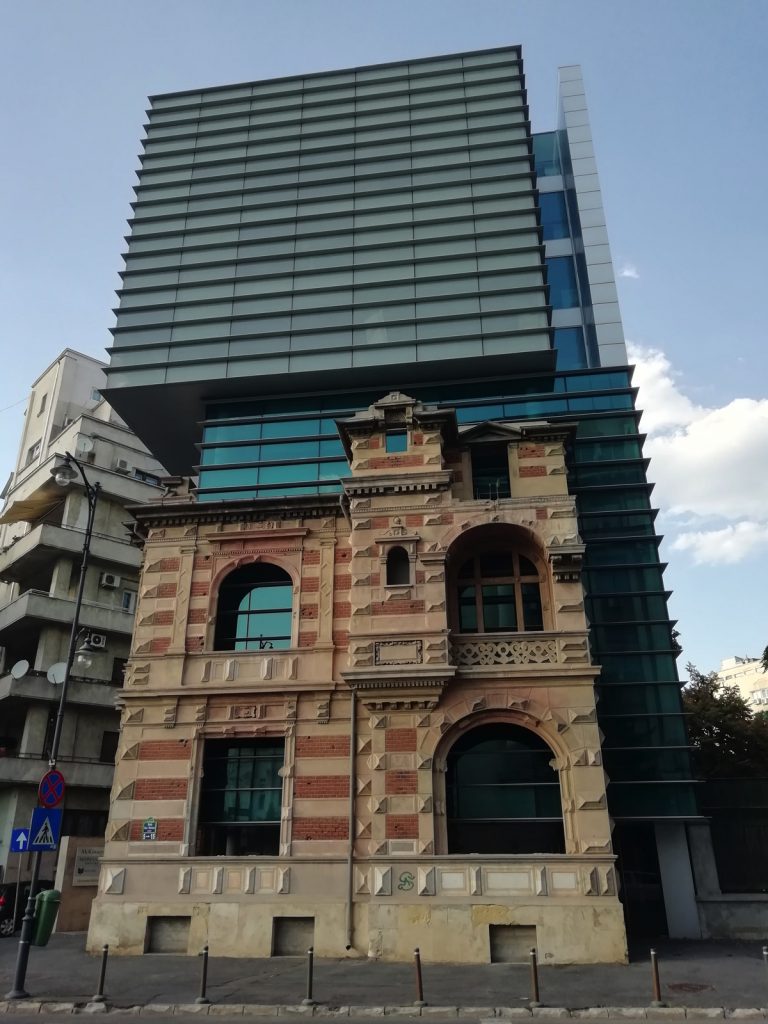
Bucharest itself was a pleasant city to visit. Once I had got used to the traffic, it was quite nice to walk around, particularly in the evening-time when the worst of the heat has passed, and it still felt safe to walk around. It is a city with a recent history, with much graffiti (including on historic buildings), crumbling pavements with mysterious holes, and an oversupply of administrative buildings, a place where the car is king (some pavements are unwalkable due to parking on them) – but also a busy, bustling place full of interesting cafes and bars.
A building within a building in central Bucharest.
Bournemouth and Poole’s Beryl Bikes system is reporting 2500 journeys on their fleet during the four days of the Bournemouth Air Festival. In time, the system is planned to have around 1000 bikes, however currently it has around 250 bikes available so this suggests an average of 2.5 journeys/bike/day. These are encouraging numbers, similar to what is seen in London’s Santander Cycles system and possibly larger than any other system in the UK apart from nearby Brighton, showing that the south coast of England is a bit of a winner for bikeshare systems.
It does also suggest that Beryl might have “cracked” how to make a commercially viable, affordable and sustainable mid-size system. Beryl Bikes are dock-based, but the docks are simply painted on the ground.
London’s main bikeshare system, Santander Cycles, is looking like it is finally going to grow again, after London’s Cycling Commissioner has announced a small expansion, covering the Rotherhithe and Bermondsey areas. Despite being close to the centre of London, this area has not had Santander Cycles before. The system last expanded in February last year, to Brixton. Since then, the mobility-as-a-service industry has continued to evolve, and in the absence of eScooter systems (not allowed under UK law), there are now five other bikeshare systems operating in central London, including two virtual-dock-based systems (Freebike and Beryl Bikes) and three dockless systems (Mobike, Jump and Lime), providing some competition to Santander Cycles, although it still has more bikes (and, likely, more journeys-per-day) than the rest put together.
The expansion will happen once the latest Cycleway, C4, has been fully constructed, and as this doesn’t have an exact end-date (Spring 2020 is the current plan), it also means there is no date commited to the corresponding expansion of the bikeshare. However, as TfL has said several times that there were no plans for expansion, while equivalent systems in New York and other major cities have continued to grow regularly, the change of policy is encouraging.
Rotherhithe and Bermondsey have long asked for bikeshare. Mobike has intermittently operated in the area, but there are many possible journeys that would integrate with the existing Santander Cycle docking station footprint.
Hirebike, the bikeshare system in Lincoln, has announced that pedelecs (electric bikes) are joining its existing manual system. A number of docking stations have been converted to take electric bikes as well as manual ones, and at least one electric bike is available for hire, along with the existing non-assist bikes. Lincoln is a small city surrounded by a number of villages, some with docking stations, the distances mean it makes a lot of sense to have some electric capability in the fleet. Although the area is mainly flat, central Lincoln is on a hill – indeed the street between the old and new towns (and depicted in the graphic above) is called “Steep Hill” so, for example, students getting to the cathedral area, from the university campus on the waterside, will no doubt appreciate the easier pedalling.
Lincoln’s system is quite small (around 90 bikes, including 1 electric currently, across 26 docking stations) but usage will no doubt be boosted by this innovation.
BTN Bike Share, a hybrid system launched in the tourist and student city on 1 September 2017, has increased its fees for the first time. Previously, casual hires were £1 for up to 35 minutes and then 3p/minute. They are now: £1/hire + 3p/minute. Annual subscriptions are now £72/year with 30 minutes/day ride time (down from 1 hour).
From 1 August 2019 (changes from previous shown in brackets):
Casual
Annual Membership
Membership Fee
£0
£72
Start Fee
£1
£0
Usage Fee
3p/minute
3p/minute
Usage Credit
N/A (was 35 minutes/jny)
30 minutes/day (was 60 minutes/day)
Out-of-Hub* End Fee
£2
£2
Out-of-Hub* Start Credit
£1
£1
* Bikes parked near hubs (e.g. if the hub is full) are not considered to be out-of-hub.
The changes in charges seem designed to encourage shorter journeys, which, as this is a popular, well used system, is likely to make it more efficient. BTN Bike Share may in fact be the UK’s most well used bikeshare system.
Trip Numbers
Some data on usage between the launch and July 2019 (i.e. 22 months):
1.25 million miles travelled (2 million km). With an average of 320 bikes over 570 days that means each bike does an average of 11km a day – impressive!
650,000 journeys. This suggests an average journey of 3km and a typical 3-4 trips per bike per day (t/b/d). 3km is higher than the ~1-2km average distance travelled on a bikeshare bike across other cities, but then research does suggest electric bikeshares typically do result in longer journeys.
80000 subscribers. This sounds like a hugely impressive number considering the population of Brighton – so I wonder if this is actually the number of distinct users, including visitors taking one-off trips. I can’t believe that 80000 people are paying the annual membership fee.
As of July 2019, the system reports they have 570 bikes and 68 hubs. On Bike Share Map we’ve seen a maximum of 459 bikes available for hire, seen at the end of May 2019 – a discrepancy of 24%. However, the number of hubs is correct.
Our own t/b/d research, looking at docking station data, suggests:
Q1
Q2
Q3
Q4
2017
–
–
No data
2.3
2018
1.5
4.7
5.4
3.0
2019
2.8
3.9
We detected approximately 690,000 journeys which is broadly consistent with the published number. We notice that Brighton sees around 10% more journeys on weekdays than weekends.
(Data courtesy of James Todd.)
The system is publically funded, with the council investing £290,000, and the national government investing £1.6 million. The council receives back 50% of profits above £330k made by the operator.
BTN Bike Share is operated by Hourbike on behalf of Brighton & Hove City Council. It uses Social Bicycles pedelec bikes, an older version of those used by JUMP systems. Social Bicycles subsequently created the JUMP brand for their electric bikes and were then bought by Uber.
It remains to be seen if the fees increase will dent the popularity of the system, and whether it will cause a shift towards being more tourist used – a less price sensitive segment. Any weekend/weekday t/b/d change should be detectable in due course.
Exeter’s bikeshare, Co Bikes, relaunches on Friday, having been suspended in early June – thus missing the peak summer season.
The system was, and still is, an electric system supplied by nextbike and operated by a local cooperative (hence the co- in the name), and promises a substantially larger system of “just under 100 bikes” and 14 docking stations. Nextbike appears to be handling telephone support as their London number is listed as the number for users to call with queries.
The main change from the older system which ran from October 2016 until June this year, is that it is hybrid – it has the ability to allow journeys to start and finish away from the docking stations. It will also, according to the publicly, be much larger – up to 5 times the size. The older system had a maximum of 20 bikes available, scattered across 7 docking stations which were well placed at railway stations, university campuses and key civic points but ultimately limited the possible journeys. Bikes in the older system could in fact be left out of docking stations but this was not encouraged by the operator.
The combination of expensive electric bikes which can be left anywhere in any British city always brings concerns about theft and vandalism, but hopefully Exeter will succeed where Derby, Manchester, Stockport and Newcastle have failed.
The West Midlands Bikeshare is no more, after Transport for West Midlands (TfWM), part of the West Midlands Combined Transport Authority (WMCTA), cancelled its contract with nextbike, the provider and operator, citing persistent breaches of contract – this likely relating to delays to its wider rollout of 3000-5000 bikes and proposed changes to the system such as increasing fees, not covering the full TfWM area, and struggling to find technological solutions to integrate with the region’s “Swift” multi-modal transit card. The bikeshare had been operating on a trial basis, covering just 25 non-electric bikes across 5 docking stations in a small area in central Wolverhampton in the north-west of the proposed operating area, plus a single docking station in Birmingham itself. The system had already been delayed from late last year. It had been announced in a blaze of publicity by West Midlands elected major Andy Street, at the beginning of 2018.
As recently as a week before the collapse, nextbike had announced that it had resolved issues with not finding a major sponsor of the system and a parts shortage, and that the larger rollout was imminent. The docking stations have already had their bikes removed, and the stations themselves, which are placed on the ground, will also be shortly removed. The system had seen around 7 journeys a day during the 6 months of the trial – that’s 7 in total not 7 per bike. One issue was that the docking stations were placed close together, only allowing journeys between points in the compact city centre that could be easily and probably just as quickly walked. Smarter placement, such as by the railway station, tram stops, football stadium, main public parks and suburban community hubs, would have created more journey opportunities.
Bikesharp tried out the trial system in Wolverhampton a couple of times, and was impressed by the quality and condition of the bikes (helped perhaps by their very low usage rate). The system was relatively complicated to use, however, with a cable lock that needed to be stowed and journeys that could not be finished simply by docking the bike. There were also some issues with GPS accuracy – a bike that was incorrectly docked was shown on the app’s map to be on the other side of a main road:
The two parties haveboth taken to the press to explain their views on the reasons for the collapse. WMCTA is saying it is looking for another provider, but the omens are not good. The West Midlands area, with Birmingham at its heart, is a large, low density urban area, bisected by motorways, with few current cycling journeys and high private car usage, compared with many other cities in the UK. This is despite its relatively flat landscape and a large network of canals, with corresponding towpaths, making for an ideal cycling network. Certainly, a bikeshare system could work in small, targetted parts of the region, if target sites are well chosen.
The Google Maps Android app now shows the locations of available Lime bikes, which, in the UK, operate in much of London, Milton Keynes and Oxford. It is, for now, quite well hidden.
The app shows the bikes as a potential option when planning a journey, although not as a dedicated entry in the mode choice “band”. Instead, they currently appears as:
1. A sub-option when you choose cycling (which you would probably only do if you had your own bike). “Your bike” is the default, but Lime appears as a toggle at the bottom of the app.:
On selecting it, it will show the route to the nearest bike, and also other nearby Lime bikes:
2. An “also consider” option when looking a public transport options – interestingly this one picks a slightly further away Lime bike, but one which results in a much shorter overall journey (7 minutes here) than the “dedicated cyclist” option above:
3. A suggested alternative “route” when looking at the walking route map, which also picks the shortest walk/cycle combination route:
The data displayed includes the number of bikes “nearby”, the walking time to the nearest one, a confirmation that it is an “electric bike” (i.e. pedelec), its battery range, a guideline journey length and time, and an estimated cost.
Google does know Lime’s operating area – if you choose a origin or destination that is outside of it, then the option doesn’t appear. However, it doesn’t show this boundary in the app itself. Lime’s boundary is fairly nebulous – it has two official operating areas in north and south London but in practice currently allows journeys to start/end in the central area between the official areas, without penalties being applied.
One thing to note is, the bikes don’t appear in the app if you are not planning a journey. So it is, for now, rather hidden away. However, the general public will probably not think of using a single-mode app for their journey planning, no matter how each of the operators would love them to. So, having this information on Google Maps is a really big deal for the 99% of people who would see bikeshare as an alternative rather than the first choice mode in their mind. Especially as the other 5 systems currently operating in central London (Santander Cycles, Mobike, Jump, Freebike and Beryl) are not currently offered as an option. Google Maps does show Santander Cycle docking stations (if you zoom right in) with the current number of bikes there, but doesn’t appear to suggest journeys with these.
CityMapper continue to also map Lime bikes, along with Mobike and Santander Cycles – so 3 of the 6 central London systems:
In both Google Maps and CityMapper, the app will switch away to the dedicated Lime app (if you have it installed) when you start a transaction (i.e. hiring the bike).
TfL’s own journey planner suggests Santander Cycles, but none of the other five, on the journey planner section of its website. Uber’s app is having a go at trying to be a multi-modal planner by including TfL rail/bus options, but of course only its own “Jump” bikes for its bikeshare options. It currently feels like the rail/bus information is only there to highlight how much better/quicker its own options may be.
So, multi-modal journey planning continues to make small improvements, but we are still a long way from any one app showing all the options. Meanwhile, on the City of London/Islington border, six separate systems, all with different operating areas, fees and rules, fight it out, while for large parts of London, only driving, expensive cabs or slow buses remain the only option.